Your first agent run
By the end of this tutorial you will have launched an AI coding agent against a project, watched it work in live mode, and read back exactly what the run cost. It takes about ten minutes and assumes you can already sign in to a SupaCloud workspace with at least one project.
1. Open the cockpit
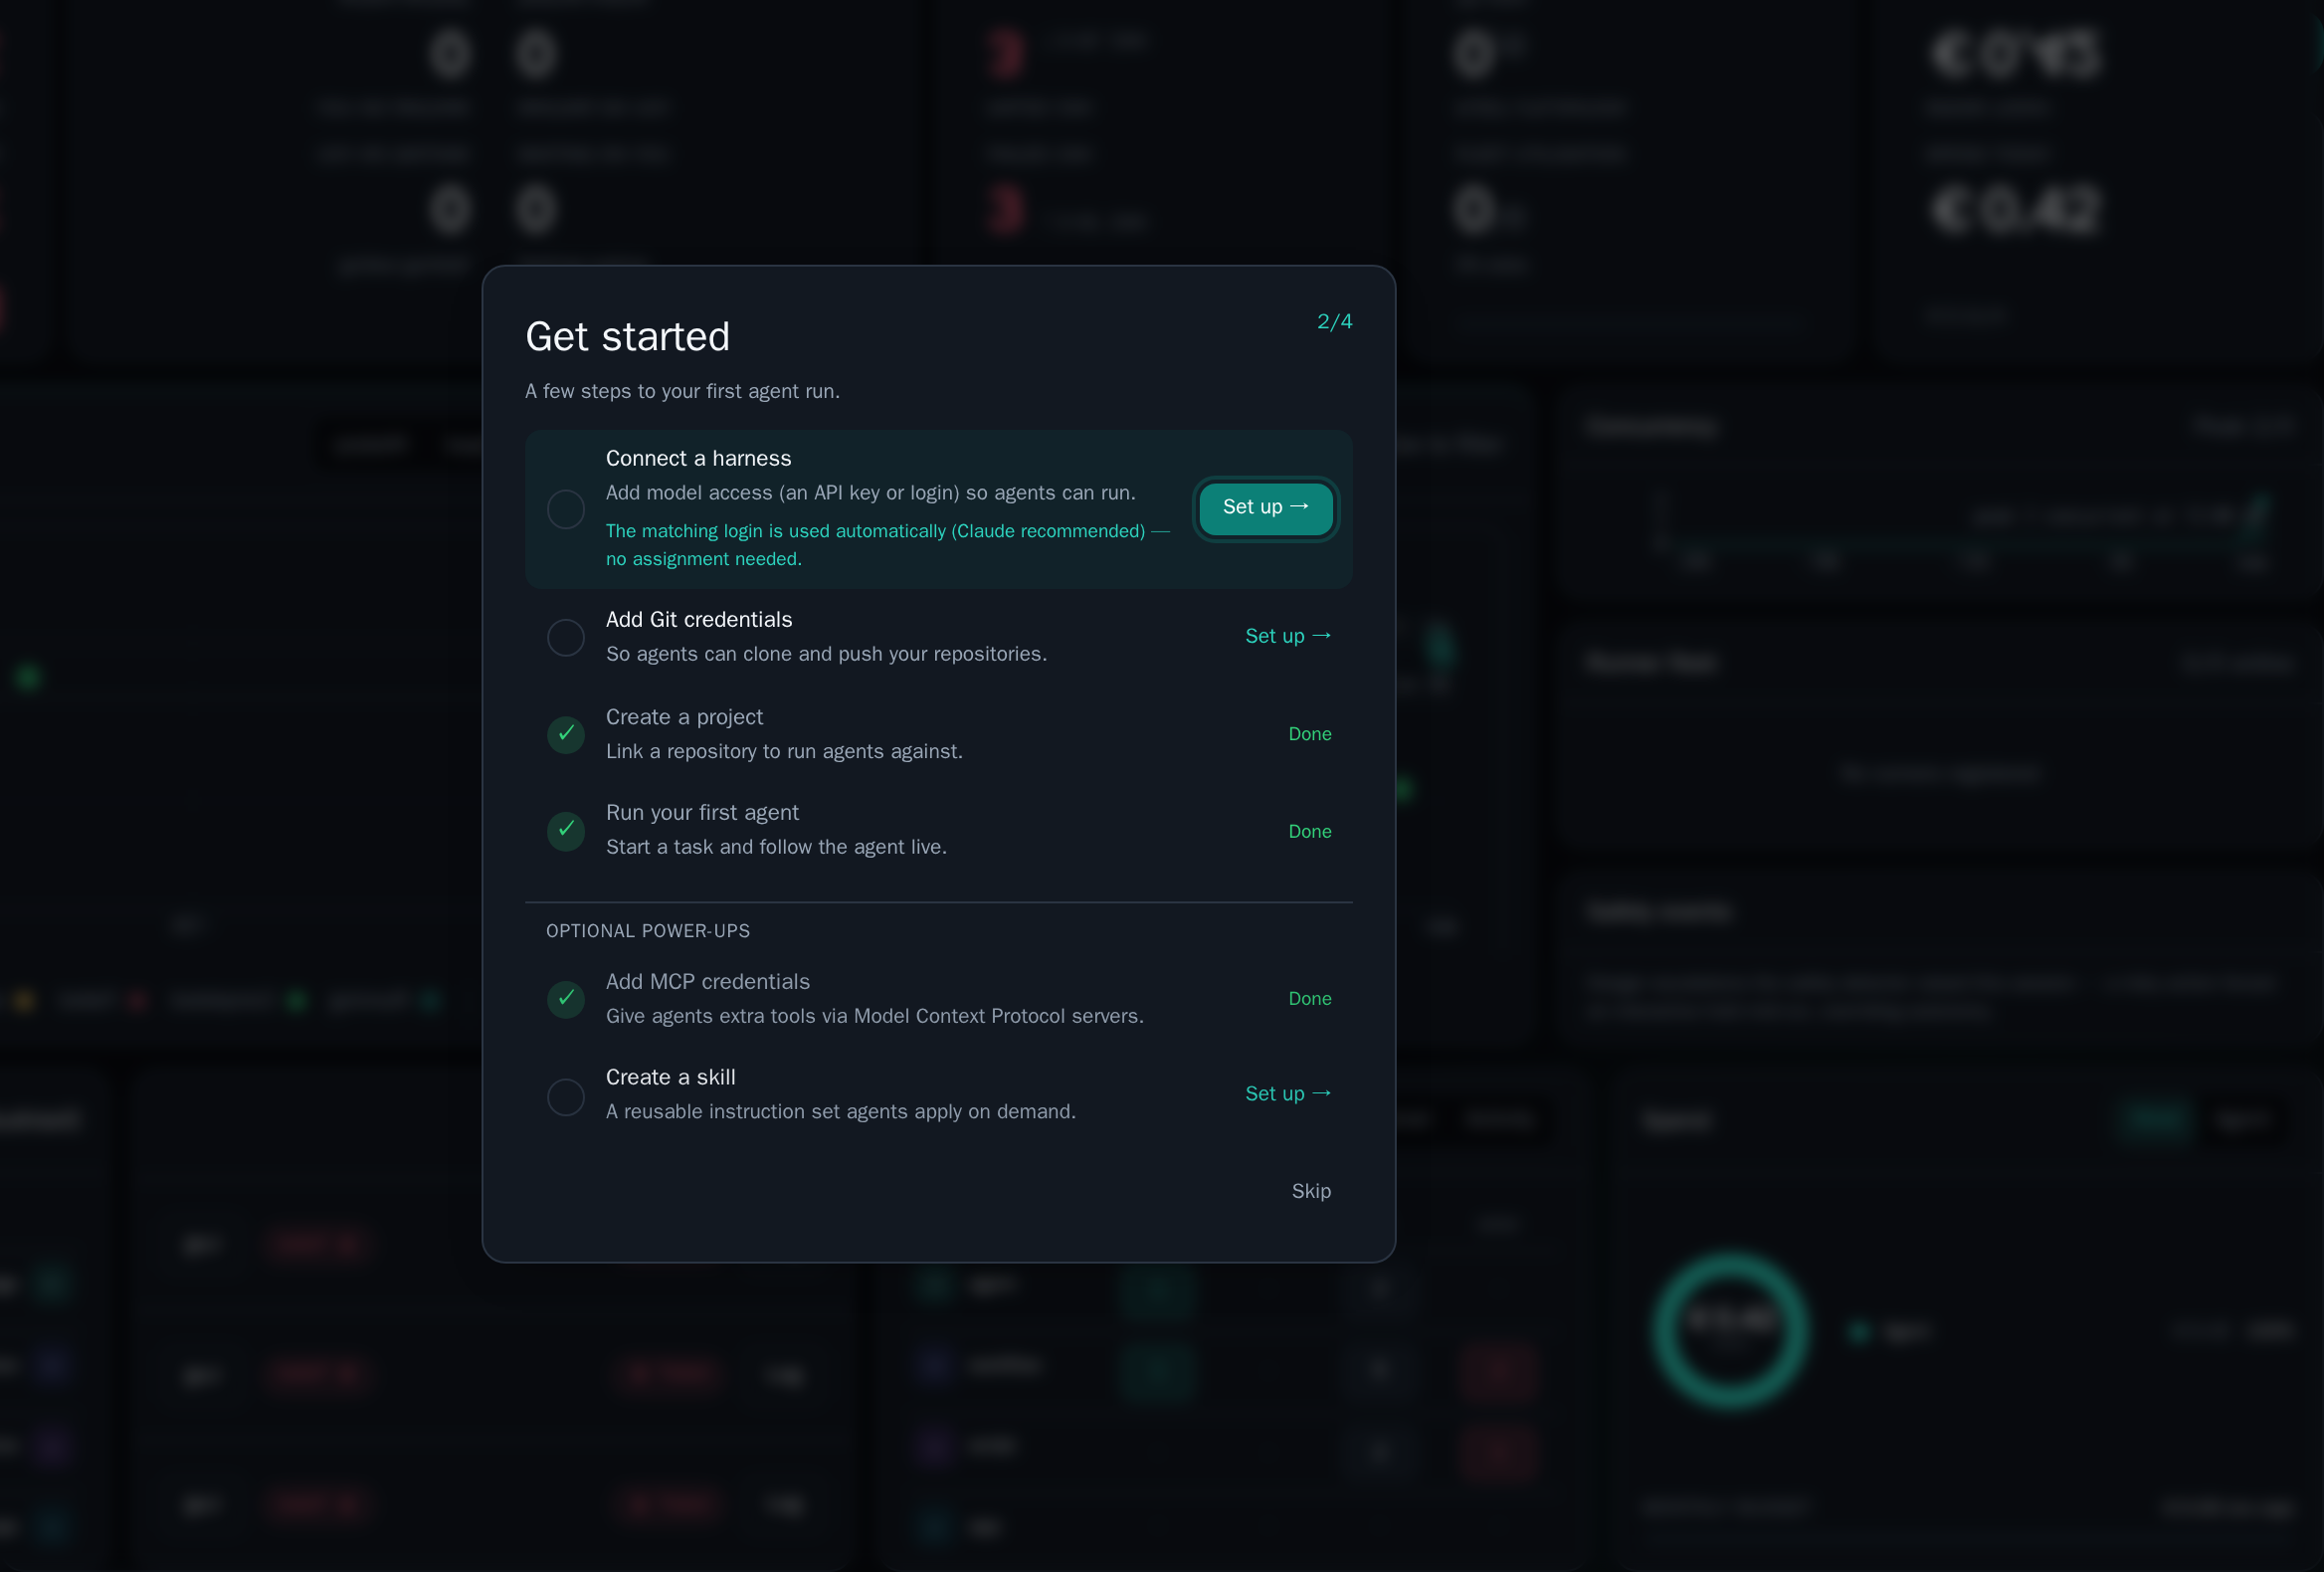
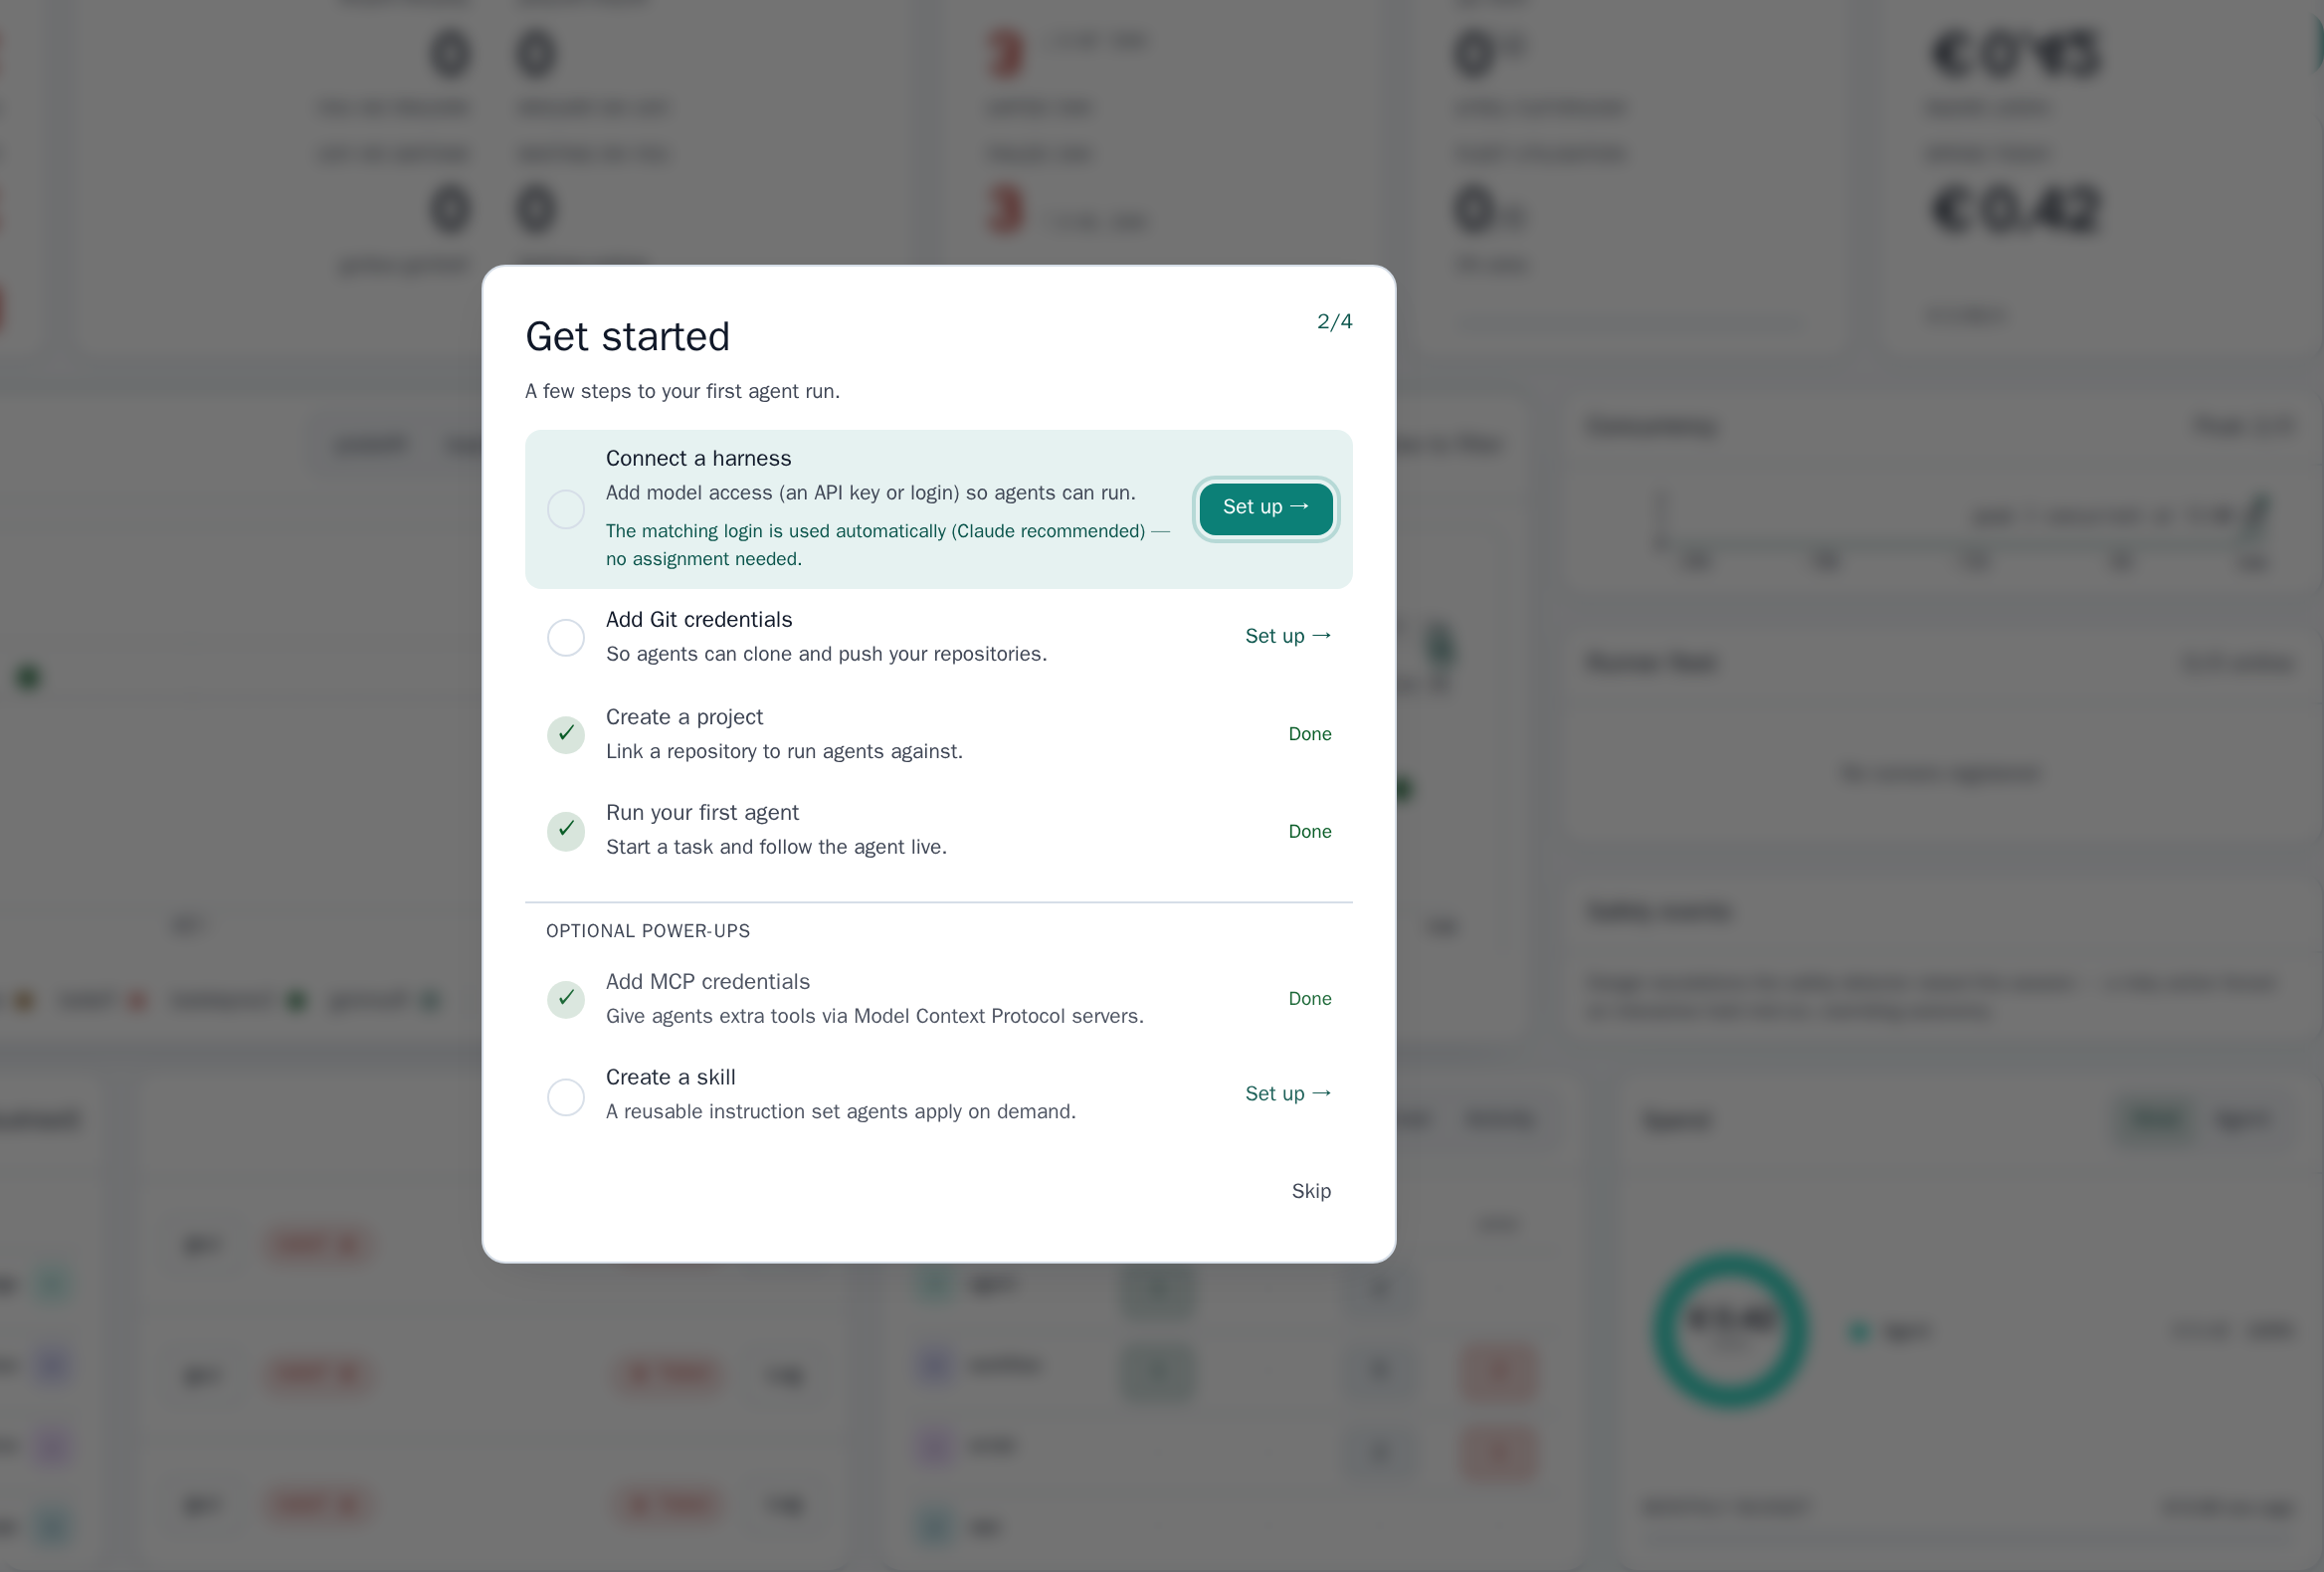
Section titled “1. Open the cockpit”Sign in and you land on the dashboard — the operator cockpit. It shows your active and waiting runs and a live run stream, plus panels for the runner fleet, spend, and an attention queue. Every run you launch surfaces here.
2. Launch a run from the web terminal
Section titled “2. Launch a run from the web terminal”SupaCloud ships a web terminal at /cli that drives the same service layer
as the UI. It is the quickest way to launch your first run.
-
Open
/clifrom the sidebar (or navigate to it directly). -
List your projects to confirm the name you will target:
projects -
Launch a run. The
runcommand takes a project, an agent, and a prompt, then drops you straight into live mode:run my-project claude "Add a /health endpoint that returns 200 and the build SHA"my-project— the project name from step 2.claude— the agent to use.- everything after that — the prompt for the agent.
3. Follow the run live
Section titled “3. Follow the run live”After run, the terminal is in live mode: the agent’s thinking, tool calls,
and messages stream in as they happen. In live mode you don’t need a command
prefix — just type and press Enter to send the agent an intervention
(a nudge, a correction, an answer to a question). Press Ctrl+C
to leave live mode without stopping the run.
If you ever leave and want to come back, re-enter live mode with the run’s id:
follow <id>You can also intervene from outside live mode with intervene <id> <message>, or
stop a run with cancel <id>.
4. Read the result and its cost
Section titled “4. Read the result and its cost”When the agent finishes, open its run detail page — click the run from the dashboard or the runs list to peek at it, then click Open task (or Open workflow) in the drawer header to open its full detail page (each run is also a deep-linkable URL). The panel shows the trigger, the duration, the start and finish timestamps, the container the run used, and — right in the header metarow — the agent cost in USD. You don’t need to leave the UI to see it.


The same figures — status, cost, duration and last activity — are also available from the web terminal, if you prefer the keyboard:
task <id>What you learned
Section titled “What you learned”- The dashboard is the cockpit for every run.
run <project> <agent> <prompt>launches a task and enters live mode.- In live mode, Enter sends an intervention; Ctrl+C exits.
- The run/task detail panel shows status, duration, timestamps and cost right in the UI; the web terminal’s
task <id>reports the same.